Over the last year, the Pembroke Concentrated Fund (“PCF”) gained approximately 5% compared to a 4% decline in its benchmark, the Russell 2000 Index (“R2000”). Much of PCF’s absolute performance came in the first quarter of 2023, as the Fund and US markets more generally recovered from a challenging 2022*.
* All performance metrics stated for PCF A-Class units in CAD. Detailed performance by class and currency listed below.
| 1-Month | 3-Month | YTD | 1-Year | 3-Year | 5-Year | Since Inception, annualized | Since Inception, cumulative | |
|---|---|---|---|---|---|---|---|---|
| PCF A, CAD | -3.35% | 7.43% | 7.43% | 4.69% | 19.56% | 11.20% | 12.22% | 81.40% |
| PCF A, USD | -2.73% | 7.47% | 7.47% | -3.39% | 21.28% | 10.14% | 10.15% | 64.86% |
| PCF F, CAD | -3.44% | 7.12% | 7.12% | 3.46% | 18.17% | n/a | 9.35% | 36.75% |
| PCF F, USD | -2.82% | 7.17% | 7.17% | -4.53% | 19.87% | n/a | 8.69% | 33.76% |
| R2000, CAD | -5.31% | 2.65% | 2.65% | -4.27% | 15.68% | 5.73% | 5.97% | 34.92% |
| R2000, USD | -4.78% | 2.74% | 2.74% | -11.61% | 17.51% | 4.71% | 4.02% | 22.56% |
| S&P 500, CAD | 3.09% | 7.41% | 7.41% | -0.07% | 16.75% | 12.27% | 11.51% | 75.60% |
| S&P 500, USD | 3.67% | 7.50% | 7.50% | -7.73% | 18.60% | 11.19% | 9.46% | 59.51% |
FTSE Russell is a trading name of FTSE International Limited (“FTSE”), Frank Russell Company (“Russell”), FTSE TMX Global Debt Capital Markets Inc. and FTSE TMX Global Debt Capital Markets Limited (together, “FTSE TMX”) and MTS Next Limited. The Russell 2000 is a market cap weighted index that includes the smallest 2,000 companies covered in the Russell 3000 universe of US-based listed equities. The index is designed to be broad and unbiased in its inclusion criteria and is recompiled annually to account for the inevitable changes that occur as stocks rise and fall in value. Russell refers to the various indices copyrighted and trademarked by the Frank Russell Co. The S&P/TSX Composite is the headline index for the Canadian equity market. It is the broadest in the S&P/TSX family. The S&P/TSX Completion Index is comprised of the constituents of the S&P/TSX Composite Index that are not included in the S&P/TSX 60 Index. The index was formally the S&P/TSX MidCap Index. The FTSE TMX Indices comprise of a series of benchmarks which are designed to track the performance of bonds denominated in Canadian Dollars (CAD). The FTSE TMX Canada Universe Bond Index is the broadest and most widely used measure of performance of marketable government and corporate bonds outstanding in the Canadian market.
Performance Commentary
Since its inception in January of 2018, PCF has compounded value at approximately 12.2% per annum, compared to the R2000 at roughly 6.0%. Both the first quarter of 2023 and the trailing one-year period were favourable from an absolute and a relative perspective. PCF grew 7.4% in the first quarter of 2023, and 4.7% over the last year, compared to the R2000’s 2.7% gain in the first quarter, and -4.3% decline over the trailing 12 months.
Our strong year-to-date performance was driven by our positions in the technology, industrials and communication services sectors, slightly offset by headwinds in several of our consumer discretionary and healthcare positions. At the end of this article, you will find more detailed commentary on our two most significant contributors and detractors from performance.
Portfolio Actions
Our trading activity picked up year-to-date, with the portfolio growing to 19 total positions, following several year-end tax loss sales in late December. The team added Shutterstock (“SSTK”), Pure Storage (“PSTG”) and Core & Main (“CNM”) to the portfolio. These are all high-quality businesses, with excellent growth prospects and dominant positions in their end markets.
Shutterstock owns the world’s largest repository of stock photos and is building an enviable position in stock videos and music. Furthermore, the company is leveraging its partnership with OpenAI to attack the artificial intelligence image generation space and is poised to disrupt, rather than be disrupted by AI. SSTK’s brisk growth is complemented by a high margin structure, aligned management team and a strong balance sheet.
Pure Storage is the leading provider of all-flash data storage hardware and storage management software. The company has continually disrupted the storage market with better, faster, cheaper and easier to use products, and has consistently grown well above the market. Despite growth rates comfortably in the double digits, the company boasts strong margins and returns, significant alignment, and a conservatively financed balance sheet.
Core & Main is a leading distributor of water, wastewater, storm drainage and fire protection products. Pembroke has a long history of investing in capital light distribution models, like CNM, and sees many similarities with past successful investments. The company benefits from an ideal market structure that enables solid growth and pricing power: fragmented customers, suppliers and competitors. Its growth algorithm is particularly compelling, with market growth, share gains, as well as mergers and acquisitions all contributing to a sustainable, double-digit topline outlook. CNM is profitable, backed by aligned investors and managers, and is underpriced relative to its quality and growth outlook.
Portfolio Characteristics
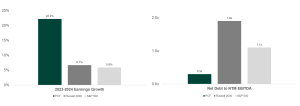
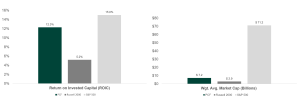
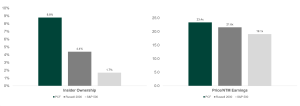
Pembroke believes that a portfolio of stocks containing the following attributes, over the long-term, should better protect capital in down markets and outperform in up-markets. Our holdings generally show faster growth, higher margins and higher returns. They are also better financed and more aligned with investor interests, as compared to the market. While you pay a slight premium over the near-term, our portfolio’s faster growth rate typically reverses that dynamic. As we often say, the PCF is “near-term expensive, mid- to long-term cheap.”


Two stocks that made positive contributions to returns of the Fund over the past 12 months
Shares of Monolithic Power Systems (“MPWR”), a leading designer of analog power management semiconductors, gained 42% in the first quarter of 2023, compared to the 3% gain in the Russell 2000 benchmark, and the 17% gain in the tech-heavy Nasdaq Composite Index. In the last quarter, MPWR benefited from a strong earnings and forward guidance report that reminded investors of the company’s tremendous secular growth potential. Furthermore, improving investor sentiment within the broader technology and semiconductor space buoyed shares after a particularly negative 2022 that saw the U.S. semiconductor index decline by 35%. Despite its strong move year-to-date, MPWR remains reasonably priced given its growth profile, quality characteristics and track record of execution. It remains a core U.S. holding for Pembroke.
Shares of Installed Building Products (“IBP”) gained 40% in the first quarter of 2023, compared to the 3% gain in the Russell 2000 benchmark. IBP is one of the largest installers of residential building insulation in the U.S. and, as such, is heavily dependent on new home construction. While 2022 was characterized by high levels of inflation, rising interest rates and fears of collapsing new home demand, 2023 has proved that years of pent-up demand, new household formation and favourable demographic trends trump higher mortgage rates. Demand for new homes is much better than feared and has led to solid investor interest in IBP shares. In the long term, our view is unchanged: IBP remains a high-quality compounder with significant multi-year upside potential.
Two stocks that made negative contributions to returns of the Fund over the past 12 months
Shares in Globus Medical (“GMED”) fell on news that the company would be acquiring Nuvasive (“NUVA”) in a transaction that would create the second-largest provider of spine surgery products. The market is skeptical due to struggles faced by other companies that have effected major mergers and acquisitions in surgical device markets. In Pembroke’s view, Globus is the best-run player in the spine surgery market, if not the entire medical device industry. It grows faster than its end market and operates at market-leading profit margins. The company has a long record of innovation, including the successful launch of a robot used in spine surgery. This robot has helped Globus steal market share from larger incumbents. The company is also launching new cutting-edge products and is pushing into new markets, such as trauma. Nuvasive has a proven sales force and unique go-to-market strategies that should complement Globus’ impressive record of innovation and engineering. The acquisition of Nuvasive offers several opportunities.
- Globus management believes it can raise the profit margins at Nuvasive from the mid-20s to mid-30s through cost cuts, manufacturing rationalization, superior raw material buying power and other synergies.
- Globus has a sales team focused on the east coast of the U.S., while Nuvasive is west coast centric. Therefore, the sales team overlap is minimal compared to prior deals in the spine surgery market.
- Globus will place its robot in the hands of the Nuvasive sales force, which should represent a large opportunity for Nuvasive to win market share with new and existing customers.
- Nuvasive is more established in the trauma sales market, but Globus has a more complete product suite; this combination of a strong sales force and superior product line-up should prove fruitful.
- Globus has also hinted that it expects sales force turnover to be minimal at Nuvasive, as Globus offers generous compensation packages to its successful sales executives.
While the short-term stock price action in a large holding such as GMED is disappointing, the combined company will be generating significant free cash flow and will have no net debt. With the drop in the share price, Globus is trading near the bottom end of the valuation range typically seen for profitable medical device companies. The upside versus downside equation is skewed in favour of long-term, patient investors. Pembroke has added to its position.
Shares of Stoneridge, Inc. (“SRI”), a producer of electronic components and control devices for global auto and truck makers, declined 13% in the first quarter of 2023, compared to a 3% gain in the Russell 2000 benchmark. Following a strong relative performance run in 2022 (SRI gained 9% compared to a 20% decline in the benchmark), the company re-encountered some of the supply chain management issues that it faced in 2021. Specifically, several of its key automaker customers in the U.S. and China temporarily ceased production in late December due to product or labour availability. While all customers had resumed production by the time of the earnings call, investors punished SRI in early March. Zooming out, SRI is poised to grow its production at two or three times the rate of the underlying market, with a robust incremental margin and return profile. We see compelling strategic value in this asset as its proprietary technology, strong market position, and favourable incremental margin structure point to significant earnings upside in the coming years.
DISCLAMER
Commissions, management fees and expenses all may be associated with mutual fund investments. Please read the prospectus before investing. The indicated rates of return are the historical annual compounded total returns including changes in unit value, reinvestment of all distributions and do not take into account sales charges or income taxes payable by any security holder that would have reduced returns. Mutual funds are not guaranteed, their values change frequently, and past performance may not be repeated.Performance is reported for both PCF A-Class and F-Class units in Canadian Dollars, net of transaction costs and net of all other fees, excluding management fees. Management fees are charged directly to unitholders based on their assets under management, except for Class F units, which are charged to the Fund. Periods greater than one year have been annualized. The performance for the portfolio and benchmark index are measured using the “time weighted” rate of return methodology.The Pembroke Concentrated Fund was converted from a pooled fund to a mutual fund on April 1st, 2020. For the period this Fund was a pooled fund, the expenses would have been higher if the Fund was a prospectus mutual fund. The above information is for the purpose of providing some insight into the performance of the Pembroke Concentrated Fund. Investment performance assumes reinvestment of dividends and capital gains and is net of transaction costs and net of all other fees, excluding management fees. Performance results will be reduced by the fees incurred in the management of the fund. No assurance can be given that an investor will not lose invested capital. Past performance is not indicative of future returns.
Other Articles Of Interest
Disclaimer
This report is for the purpose of providing some insight into Pembroke and the Pembroke funds. Past performance is not indicative of future returns. Any securities listed herein, are for informational purposes only and are not intended and should not be construed as investment advice nor is it a recommendation to buy or sell any particular security. Factual information has been taken from sources we believe to be reliable, but its accuracy, completeness or interpretation cannot be guaranteed. Pembroke seeks to ensure that the content of this document is correct and up to date but does not guarantee that the content is accurate and complete and does not assume any responsibility for this. Pembroke is not responsible for decisions or actions taken or made on the basis of information contained in this document.

